Koé
Employee Engagement Application
Project Overview:
Koé Internation is a Silicon Valley startup in the enterprise software industry. The goal at Koé is to help you promote a positive workplace culture by facilitating meaningful communication. I worked on the user research and ideation of the app, analytics dashboard, and the UI redesign of the Dashboard.
Problem:
Companies need a way to keep ongoing two-way communication with employees so that they feel their concerns are heard, recognized, and acted upon.
Solution:
A communication solution aimed to help managers and employees share, analyze, and resolve organizational issues in real-time in order to build and maintain healthy corporate culture.
My Role:
User Research
User Flows
Wireframing/Mockup- Web App
Usability testing
Programs & Tools:
Sketch
Illustrator
Invision
Team:
Steven
Marina
Challenges:
App was difficult because you had to bring a person-to-person community that already existed into a new online space.
Connecting the Employee's needs with the Manager's.
At first the Metrics weren't defined, user testing and math revealed what would be a better option.
Learned:
How companies are structured, and the differences between the different sizes.
Never underestimate the complexity of the problem; there were many variables involved which made creating a single solution challenging.
Dig into the details...
DISCOVER
Research
Ongoing research on trends and needs in organizational culture tend to be dominated by the managers’ point of view. For deeper insights on employees’ needs and goals our design team conducted additional user interviews.
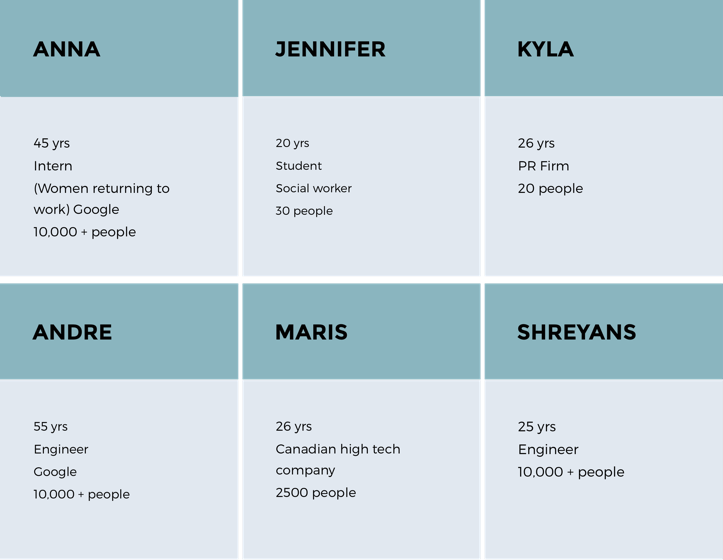
Altogether we talked to 12 people working in a wide spectrum of companies from Google to non-profits and we compared insights with published Gallup research data on employees’ engagement.
Some of the people we interviewed
Product Design
Koé noticed a gap that they could fill: A large company had the best year ever and decided to do a company-wide survey. What they found was shocking, their employees generally hated to work there. Unfortunately, even with all the surveys, the CEO didn’t know how to use them to try fix the situation.
Koé’s goal is to create a safe place for people to share feedback, in an attempt to influence and produce a healthier company culture. The product would potentially replace surveys and provide management a way to pinpoint areas with issues then act.
I established the MVP, and realized that the product didn’t seem to solve the problem they were addressing.
Insights Summary
Employees can’t express their voice because of: fear, a judgmental culture, and having no means.
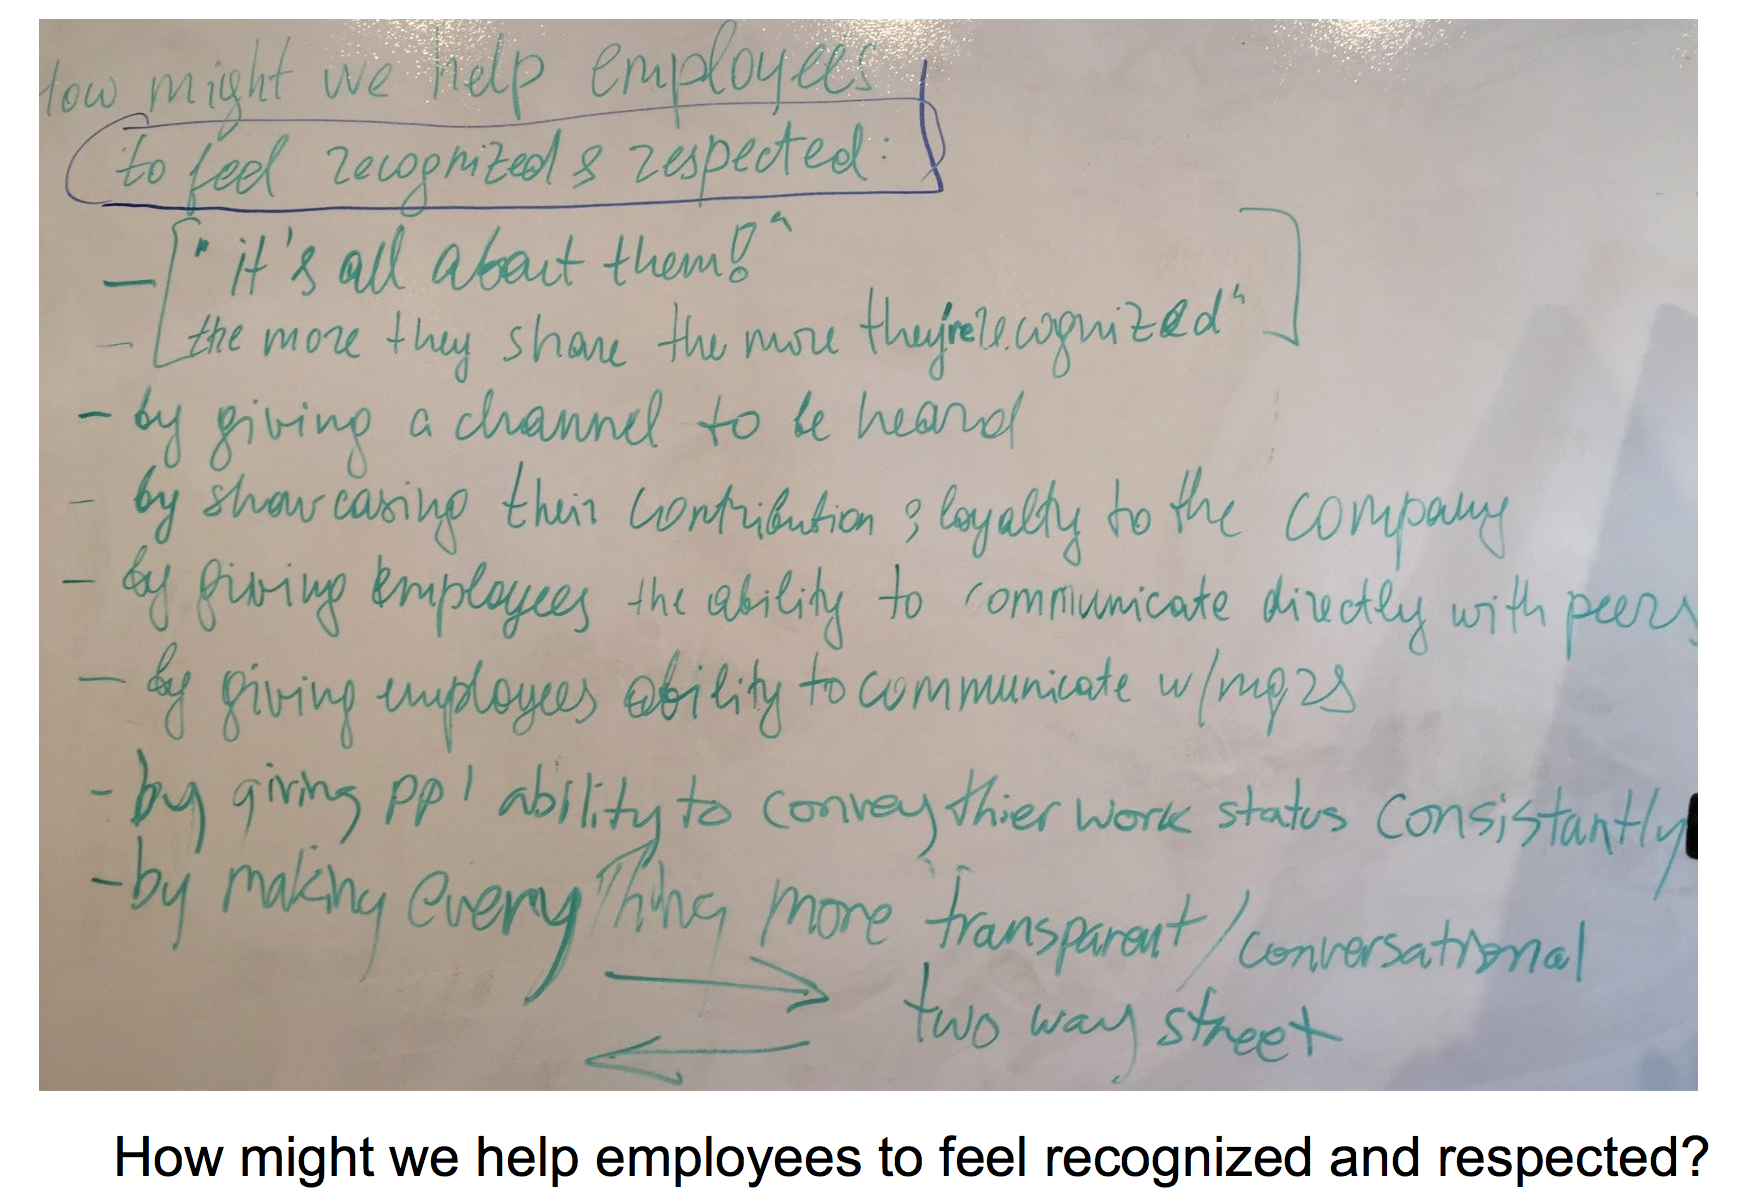
The three of us brainstormed on whiteboards to find these insights. In our interviews we found that employees feel upset when their company doesn’t consider their concerns a priority, or when promises are false, broken, or delayed. Our conclusions were confirmed by managers and human resources professionals whom we interviewed afterwards.
Employees can express their voice, but they are not heard because authority figures:
- Don’t care
- Not considered a priority
- Not sure how to use data or how to give feedback
Employees can express themselves and are heard, but issues are not resolved because authorities:
- Underestimate the importance
- Fail to follow up (in timely manner)
- Not considered a priority
- Made promises but didn't keep them
- Don’t know how
- Don’t want to change; no intention of doing anything
Employees don’t feel recognized or respected because they are:
- Not being heard (have no voice)
- Not paid what they’re worth
- Not treated fairly by peers
- Others are stealing credit for their work
Employee Pain Points and Needs
We’ve identified the following main pain points that prevent employees from giving ongoing feedback about organizational culture:- Employees feel they are not heard by the company.
- They believe their contributions are not recognized by peers and managers.
- They find that managers don’t keep their promises.
Interviewing a few Managers, we discovered what they consider most valuable to know.
- How are the employees?
- Are they feeling motivated?
- Are they happy?
- What is their status?
- How are they behaving?
- How/What are they thinking?
- Do they have a lot of questions?
- Do they have concerns?
For a tool like what Koe is trying to create, there has to be buy in at the executive level. The information provided in feedback communication should be about who is responding to the issue, and how they are going to act on the employees concern. A feedback tool that doesn't followup is not a great tool.
How might we use this information to help?
DEFINE
How Might We Help...
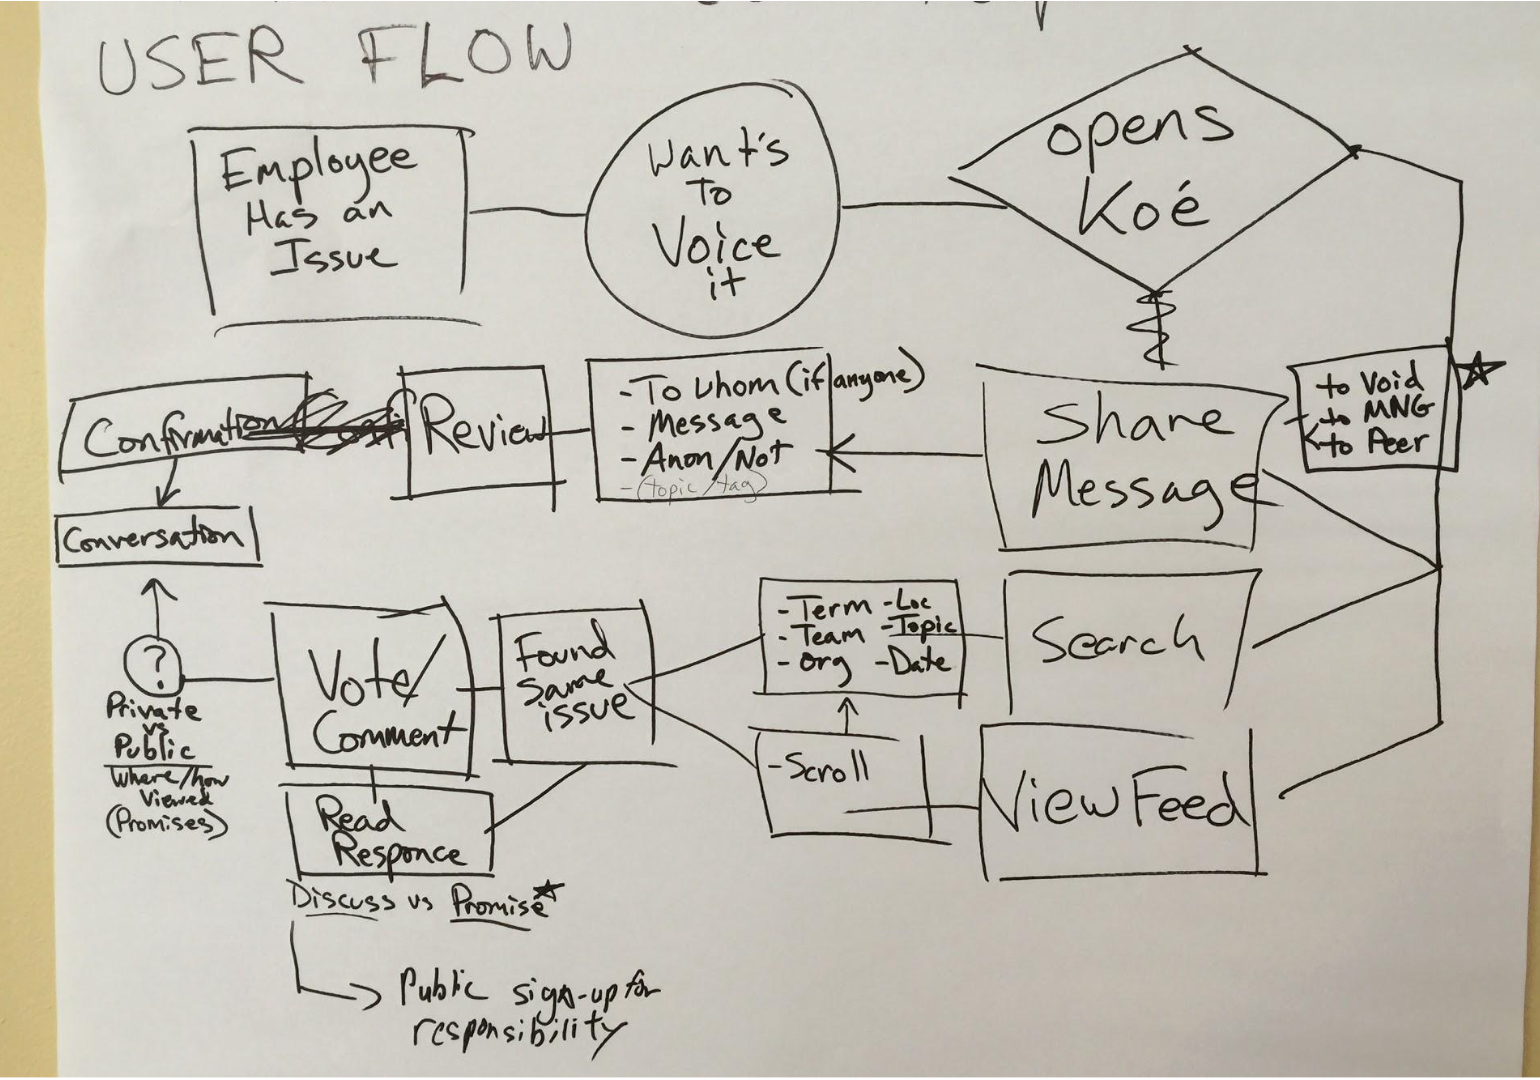
General User Flow
As employees share their sentiments, koé helps leaders to sort and aggregate data by similar feelings and keep employees and management in the loop about what is being done.
Using IBM’s Watson (or similar natural language processing technology), koé communication platform will enable managers to spot organization trends, find out what can go awry, and keep track of actions taken.
Koé's Experience:
Share:
Employees submit sentiments from their mobile device. Our app offers six Culture Categories to select from, a simple scoring system, and the ability to choose a leader to send the sentiment to. The user can also choose to send the sentiment anonymously.
Empower:
Manager and company leaders can view up-to-the-minute analysis of employee sentiment based on real-time collection of employee responses. Comparisons can be created between divisions, teams, locations, and over time. Company leaders can customize what they see and where; the initial set up can be changed according to each companies needs and structure.
Connect:
Employee sentiments are sent directly to the selected manager's mobile device. Management can then reply immediately and the conversation continues as the matter is addressed appropriately or taken offline.
There are some terms that may be confusing, but that are essential to understanding the data and the analytics:
- Sentiments: Message an employee sends to those above them, where an employee can express their emotion(s), usually tied to an event. They select a culture category, write a short message, and rate their mood at the time. This is what gives us the data needed to pinpoint the issues.
- Culture Categories: Are essentially groups used to organize sentiments by an overarching topic. After research and debate we decided that eight categories cover any topic a message my fall under.
- Pulse: The summation of the mood scores from all employee sentiments. Considered the "health" of the company or group.
- Identified Sentiments: The sentiments that were not anonymous, with the author's name available. Important in understanding and recording trends in the trust of employees towards upper management.
Culture Categories:
Dashboard
The Dashboard Design when I began working on it.
What is it?
The intention of the Dashboard was to provide managers and company leaders a way to view up-to-the-minute analysis of employee sentiment based on real-time collection of employee responses to the six key metrics. With rich analytics leaders would be afforded a clearer view into employee sentiment and the direction of their company culture.
The Dashboard is the center for monitoring all sentiment data. They can keep track of their overall company pulse, how many people are sending anonymous sentiments versus identified sentiments, daily incoming sentiments, and/or track sentiment trends based on specific cultural categories. The dashboard also contains historical trend graphs ranging from rating totals to sentiment category.
DEVELOP
Site Map
Site Map Level 1
Site Map Level 2: Pulse
Because I was tasked with redesigning the Dashboard, I focused primarily on Pulse which is where a manager finds the analytics.
From my research on Manager's wants and needs, I determined that the data and information they want to see first are:
- Overall Company Pulse: The summation of the mood scores from sentiments throughout the company, in a given time period.
- Number of New Sentiments: Both the actual number for the time period chosen, as well as the percent change from the last period.
- Response Rate: The percent of responses that were replied to, and the change from the last period.
- Identified Sentiments: The number of sentiments that were not sent anonymously, and the change from the last period.
- Company Pulse Over Time: A line graph.
- Pulse by Culture Category: A bar graph with every Culture Category's mood rating.
Site Map Level 3: Company
Sketching
I came up with some ideas for how to best represent what the Managers needed with the Dashboard. I tested them out with other people in the office, and made adjustments.
MOCKUPS
The idea is that the first page of the Dashboard is to show overall summaries of the most important data. This way, managers could easily check basic data without haveing to navigate a lot of pages.
Here's an example of what you might find on two of those detail pages.


